|
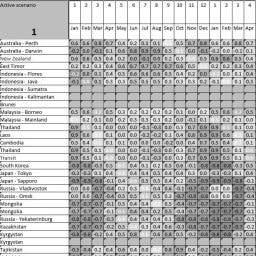
We built a spreadsheet to calculate the best time to travel. The calculation is for a trip through Africa with different scenarios, for example clockwise and counterclockwise. First we looked at the weather per month for all countries to visit (rating between -1 (poor weather) and +1 (good weather)). Subsequently we made assumptions how long we would want to stay in every country. By playing with departure date and route we can calculate the weather score (weighed average of duration of stay in a country with weather quality in the country and derived from that the best time to go). The spreadsheet with instructions can be found here.
|
Instruction
This spreadsheet is intended to calculate the best time and route for a long trip to have optimal weather. The sample is filled with a calculation for alternatives to travel from Australia to the Netherlands.
Steps:
Rating per country per month
Instead of entering a rating per country per month you can take an more automated, simpler and more consistent approach:
Steps:
- Create a line for new countries by copy insert/paste an existing line. Don't add countries at the end, but put them between the first and last one. Delete lines for countries you don't want to visit. Putting the stay duration in a country to 0 will have the same effect;
- Enter the weather rating per country per month in row B thru M: -1 is poor, 1 is good;
- You can build 3 scenarios. Enter the desired duration of stay per country per scenario in column AG etc.;
- Create formulas to calculate the arrival date ( arrival date previous country + stay length in correct sequence of countries);
- Field AI2 etc. now shows the rating per scenario. It is the weighing of rating per country * stay duration in country. -1 is poorest, 1 is best;
- Select preferred scenario in field A2. You now see the month of stay per country in white font. This makes it easy to see where you will be in good weather and where in poor weather;
Rating per country per month
Instead of entering a rating per country per month you can take an more automated, simpler and more consistent approach:
- Decide what rating you want to give to every temperature and enter that in sheet "Normalization". In the sample spreadsheet every temperature below 6 degrees C and above 42 degrees C gets rating -1, every temperature between 22 degrees C and 28 degrees C gets -1, the rest gets values in between;
- Do the same for rainy days. In the sample 0 rainy days gets +1, 30 rainy days gets -1, the rest gets values in between;
- Decide how you want to balance rain and temperature: in the sample the worst counts for 85% and the best for 15%. For example a freezing place (temperature rating -1) with no rain (rain rating +1) would get -0.7;
- Copy weather data from a site like https://www.climatestotravel.com into sheet Raw data. The "Weather" sheet is now filled automatically.


